Bristol Myers

Navigate firm data through the following pages:

Analyst Listing Primary Input Data
Derived Input Data Valuation Model Outcomes

Analyst Listing

The following analysts provide coverage for the subject firm as of May 2016:

Broker Analyst Analyst Email
BMO Capital Markets Alex Arfaei alex.arfaei@bmo.com
Deutsche Bank Research Gregg Gilbert gregg.gilbert@db.com
William Blair John Sonnier jsonnier@williamblair.com
SunTrust Robinson Humphrey John T. Boris john.t.boris@suntrust.com
Piper Jaffray Richard J. Purkiss richard.j.purkiss@pjc.com
Leerink Partners Seamus Fernandez seamus.fernandez@leerink.com
Atlantic Equities Steve Chesney s.chesney@atlantic-equities.com
Cowen & Company Steve Scala steve.scala@cowen.com
Bernstein Research Tim Anderson tim.anderson@bernstein.com
Guggenheim Securities Tony Butler tony.butler@guggenheimpartners.com
Credit Suisse Vamil Divan vamil.divan@credit-suisse.com

Return to top of page


Primary Input Data
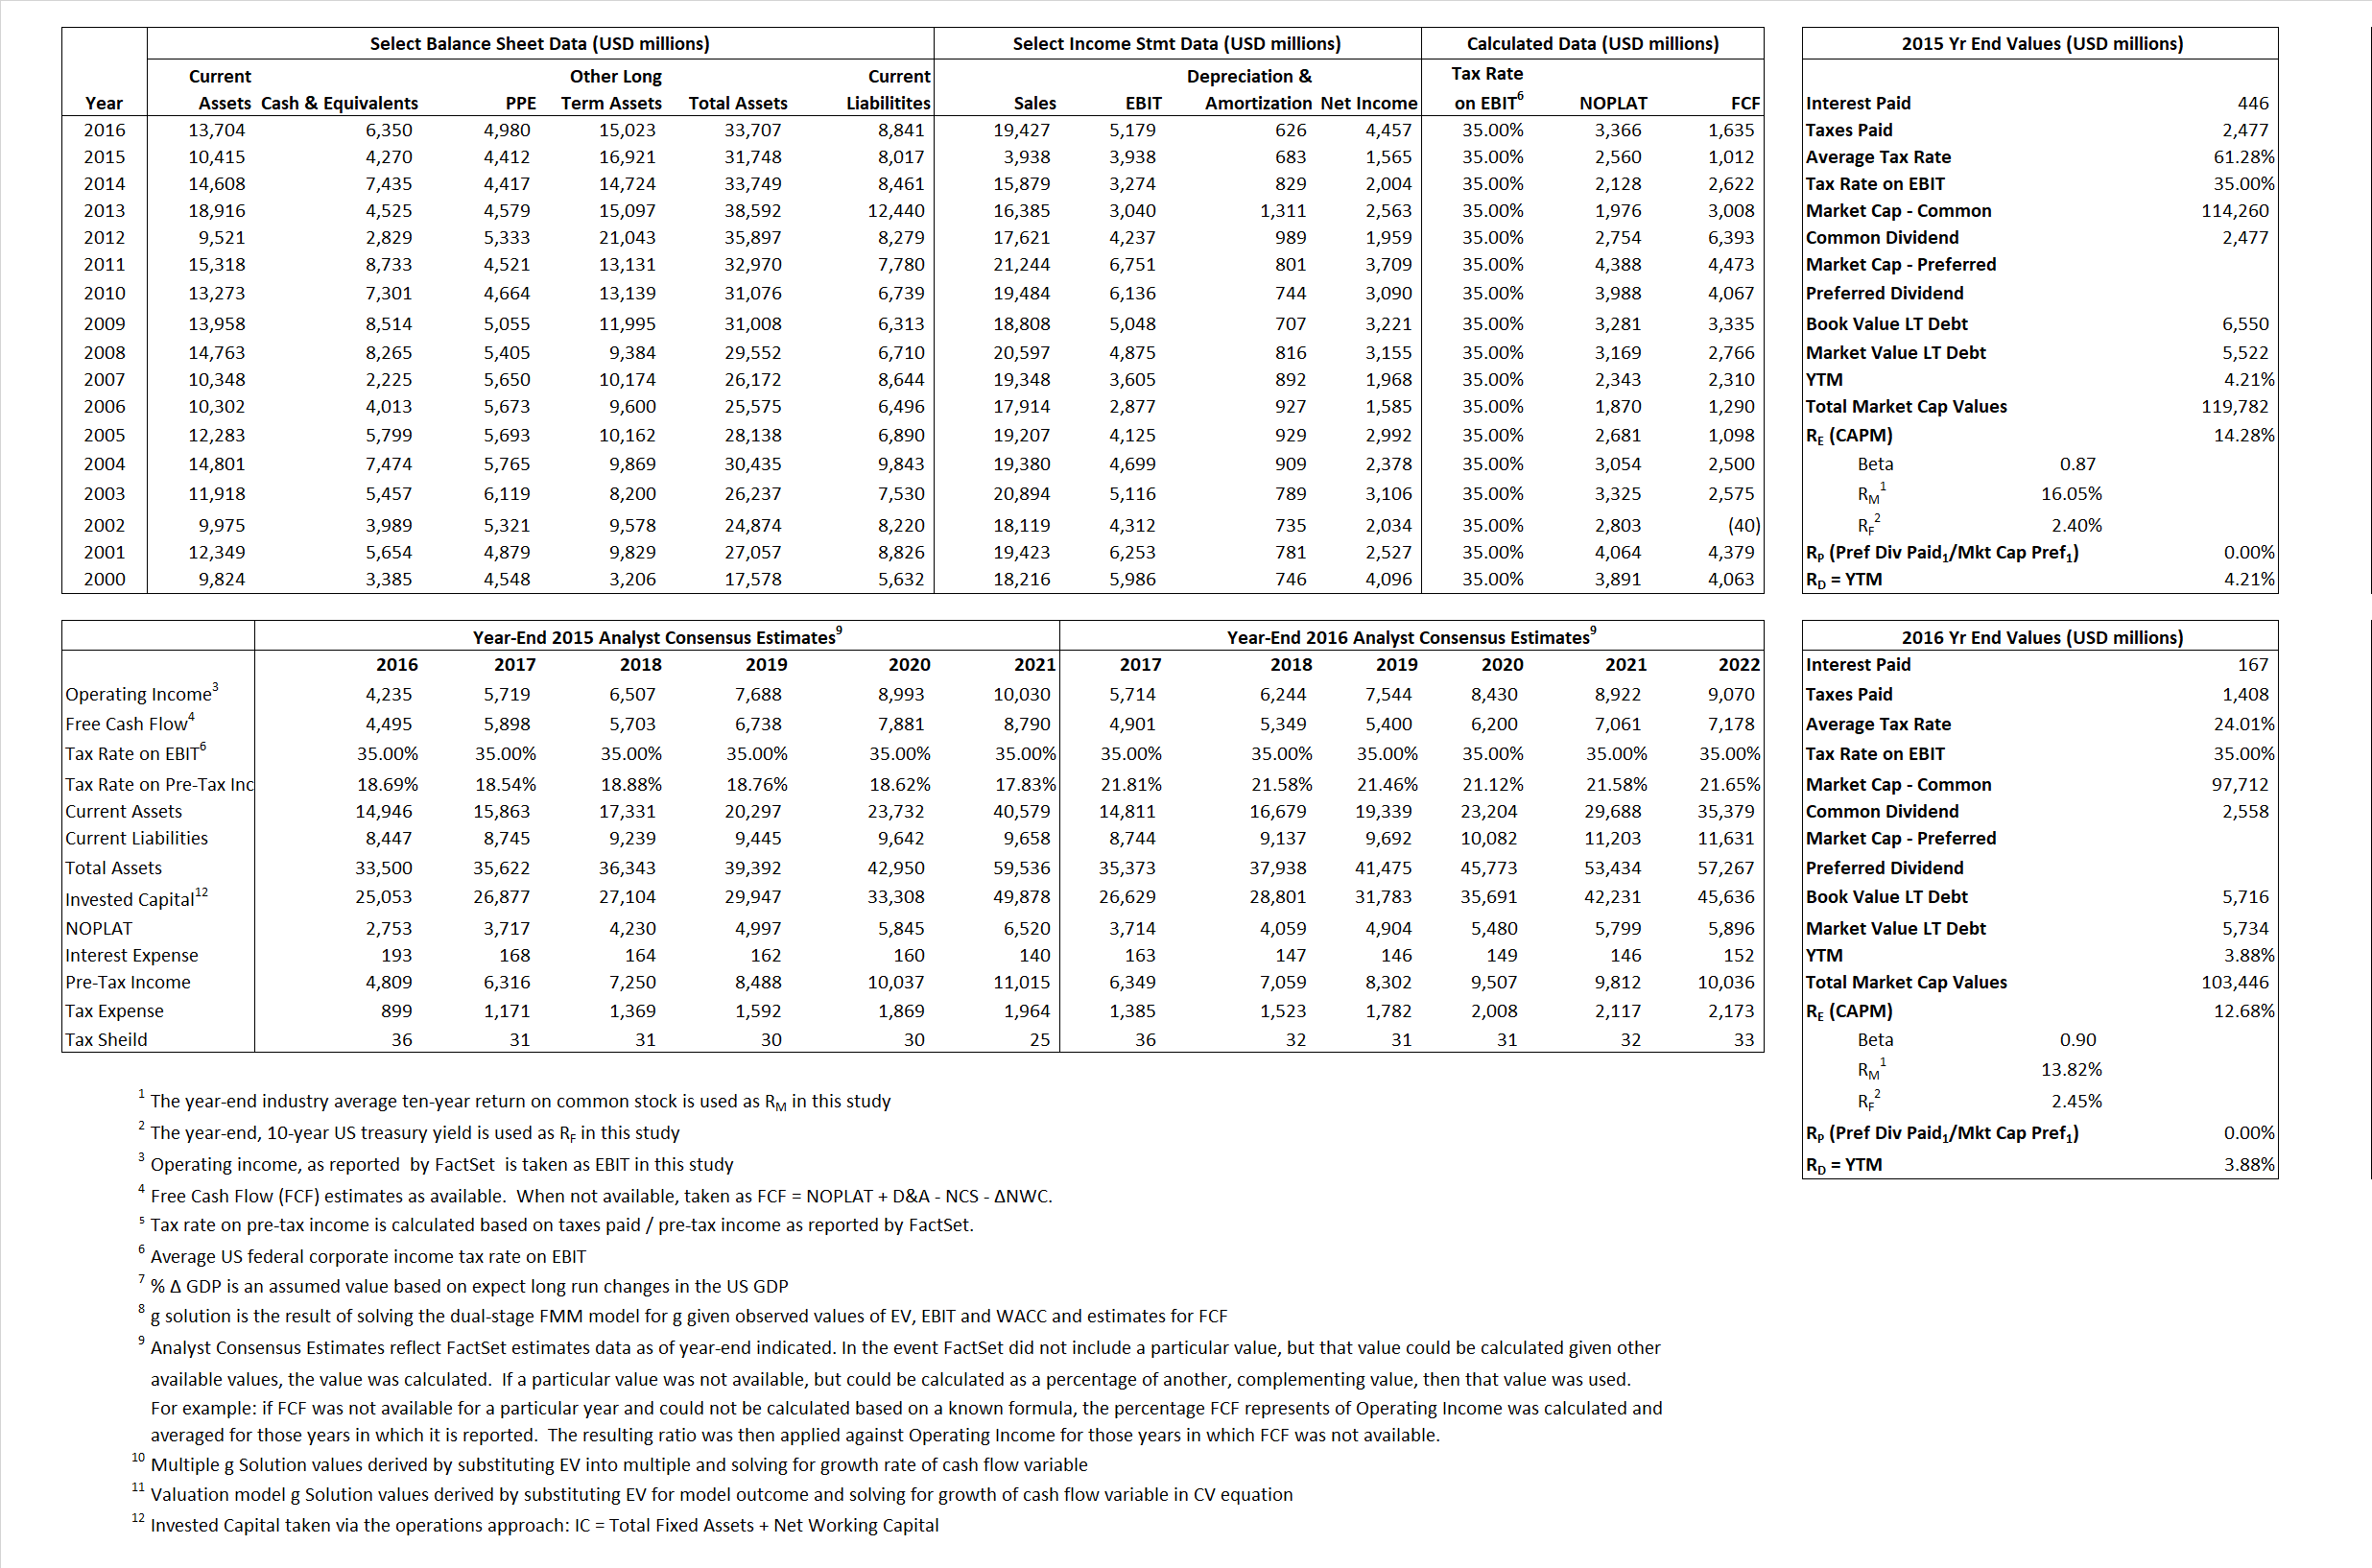
 

Return to top of page


Derived Input Data

Derived Input

Label

2015  Value

2016  Value

Equational Form

Net Operating Profit Less Adjusted Taxes NOPLAT   444  3,366 NOPLAT\, =\, EBIT\, x\, (1 \,-\, Avg \,\,Tax\,\, Rate\,\, on\,\, EBIT)
Free Cash Flow FCF  1,012   1,635 FCF\,=NOPLAT\,+\,Non-Cash\,Expenses-\Delta NWC\,-\,NCS
Tax Shield TS  273  40 TS\,=\,Interest\,\,Paid\,\,x\,\, Avg \,\,Tax\,\,Rate\,\, on\,\, Pre-Tax\,\, Income
Invested Capital IC  23,731  24,866 IC\,=\,Fixed\,\,Operating\,\,Assets\,\,+\,\,Net\,\, Working\,\, Capital
Return on Invested Capital ROIC 1.87% 13.54% ROIC\,=\,\frac { NOPLAT }{ IC }
Net Investment NetInv  (874)  1,761 NetInv\,=\,{ {IC}_{1}}-{{IC}_{0}}+Depreciation
Investment Rate IR -196.87% 52.31% IR\,=\,\frac {NetInv}{NOPLAT}
Weighted Average Cost of Capital WACCMarket 13.69% 12.14% WACC\,=\,\frac { E }{ V } { R }_{ E }\,+\,\frac { P }{ V } { R }_{ P }\,+\,\frac { D }{ V } { R }_{ D }\left( 1- Avg\,\, Tax\,\,Rate\,\,on\,\,Pre-Tax\,\,Income \right)
 WACCBook  8.14% 7.89%
Enterprise value EVMarket  115,512  97,096  EV\,=\,Market\,\,Cap\,\,Equity\,+\,\,Long\,\,Term\,\,Debt\,-\,Cash
 EVBook  116,540  97,078
EV/EBIT Multiple \frac{EV_{Market}}{EBIT}   29.33  18.75 EV/EBIT\,=\,\frac { EV}{ EBIT}
Long-Run Growth g = IR x ROIC
   -3.68%   7.08% Long-run growth rates of the income variable  are used in the Continuing Value portion of the valuation models.
 g = % \Delta GDP     2.50%   2.50%

Return to top of page


Valuation Model Outcomes

The outcomes presented in this study are the result of original input data, derived data, and synthesized inputs and, depending on the equational form of any particular valuation model, may result in irrelevant or implausible results.  For example, in the event WACC < g, the value of this term, often found in the denominator of an equation’s continuation value term, will be expressly negative and may result in a negative overall valuation for the firm.  In the event of a WACC < g relation, the model form as applied to the subject firm offers an irrelevant outcome.

Valuation Model Type

Label

Equational form

Key Value Driver (NOPLAT) KVD (NOPLAT) { Value }_{ DCF/KVD }=\sum { \frac { NOPLAT_{ t } }{ { \left( 1+WACC \right) }^{ t } } +\frac { \frac { { NOPLAT }_{ 1 }\left( 1-\frac { g }{ ROIC } \right) }{ WACC-g } }{ { \left( 1+WACC \right) }^{ t } } }
 
Key Value Driver (FCF) KVD (FCF)
{ Value }_{ DCF/KVD }=\sum { \frac { FCF_{ t } }{ { \left( 1+WACC \right) }^{ t } } +\frac { \frac { { NOPLAT }_{ 1 }\left( 1-\frac { g }{ ROIC } \right) }{ WACC-g } }{ { \left( 1+WACC \right) }^{ t } } }
 
Free Cash Flow FCF  { Value }_{ DCF/FCF }=\sum { \frac { FCF_{ t } }{ { \left( 1+WACC \right) }^{ t } } +\frac { \frac { { FCF }_{ 1 }}{ WACC-g } }{ { \left( 1+WACC \right) }^{ t } } }
 
Economic Profit ECON π  { Value }_{ { ECON\pi } }= I{ C }_{ 0 }+\sum { \frac { { IC }_{ t-1 }(ROI{ C }_{t}-WAC{C}_{t}) }{ { \left( 1+WACC \right) }^{ t } }+ \frac {\frac { I{C}_{0}\ x\ (ROI{C}_{1}\ -\ WAC{C}_{1}) }{ WACC-g } }{ { \left( 1+WACC \right) }^{ t } } }
 
Adjusted Present Value APV { Value }_{ APV }=\sum { \frac { FCF_{ t } }{ { \left( 1+{ k }_{ u } \right) }^{ t } } +\frac { \frac { { FCF }_{ 1 }}{ { k }_{ u }-g } }{ { \left( 1+{ k }_{ u } \right) }^{ t } } } +\sum { \frac { { TS }_{ t } }{ { \left( 1+{ k }_{ tax } \right) }^{ t } } +\frac { \frac { { TS }_{ 1 }}{ { k }_{ tax }-g } }{ { \left( 1+{ k }_{ tax } \right) }^{ t } } }
 
Forward Market Multiple FMM  { Value }_{ DCF/FMM}=\sum { \frac { FCF_{ t } }{ { \left( 1+WACC \right) }^{ t } } +\frac { { EBIT }_{ 1 }\,{x}\,{FMM}}{ { \left( 1+WACC \right) }^{ t } } }{\,\,\,; \,\,FMM\,=\,\frac{{EV}_{t=0}}{{EBIT}_{t=0}}}
 

Return to top of page