Chevron

Navigate firm data through the following pages:

Analyst Listing Primary Input Data
Derived Input Data Valuation Model Outcomes

Analyst Listing

The following analysts provide coverage for the subject firm as of May 2016:

Broker Analyst Analyst Email
Tudor Pickering Holt & Co. Anish Kapadia akapadia@tudorpickering.com
Scotia Howard Weil Blake Fernandez blake.fernandez@scotiabank.com
RBC Capital Markets Brad Heffern brad.heffern@rbccm.com
Evercore ISI Douglas Terreson doug.terreson@evercoreisi.com
Credit Suisse Edward Westlake edward.westlake@credit-suisse.com
Piper Jaffray Guy Baber guy.a.baber@simmonspjc.com
Jefferies Jason Gammel jason.gammel@jefferies.com
Wolfe Research Paul Sankey psankey@wolferesearch.com
Raymond James Pavel Molchanov pavel.molchanov@raymondjames.com
Wells Fargo Securities Roger D. Read roger.read@wellsfargo.com
Cowen & Company Sam Margolin sam.margolin@cowen.com

Return to top of page


Primary Input Data
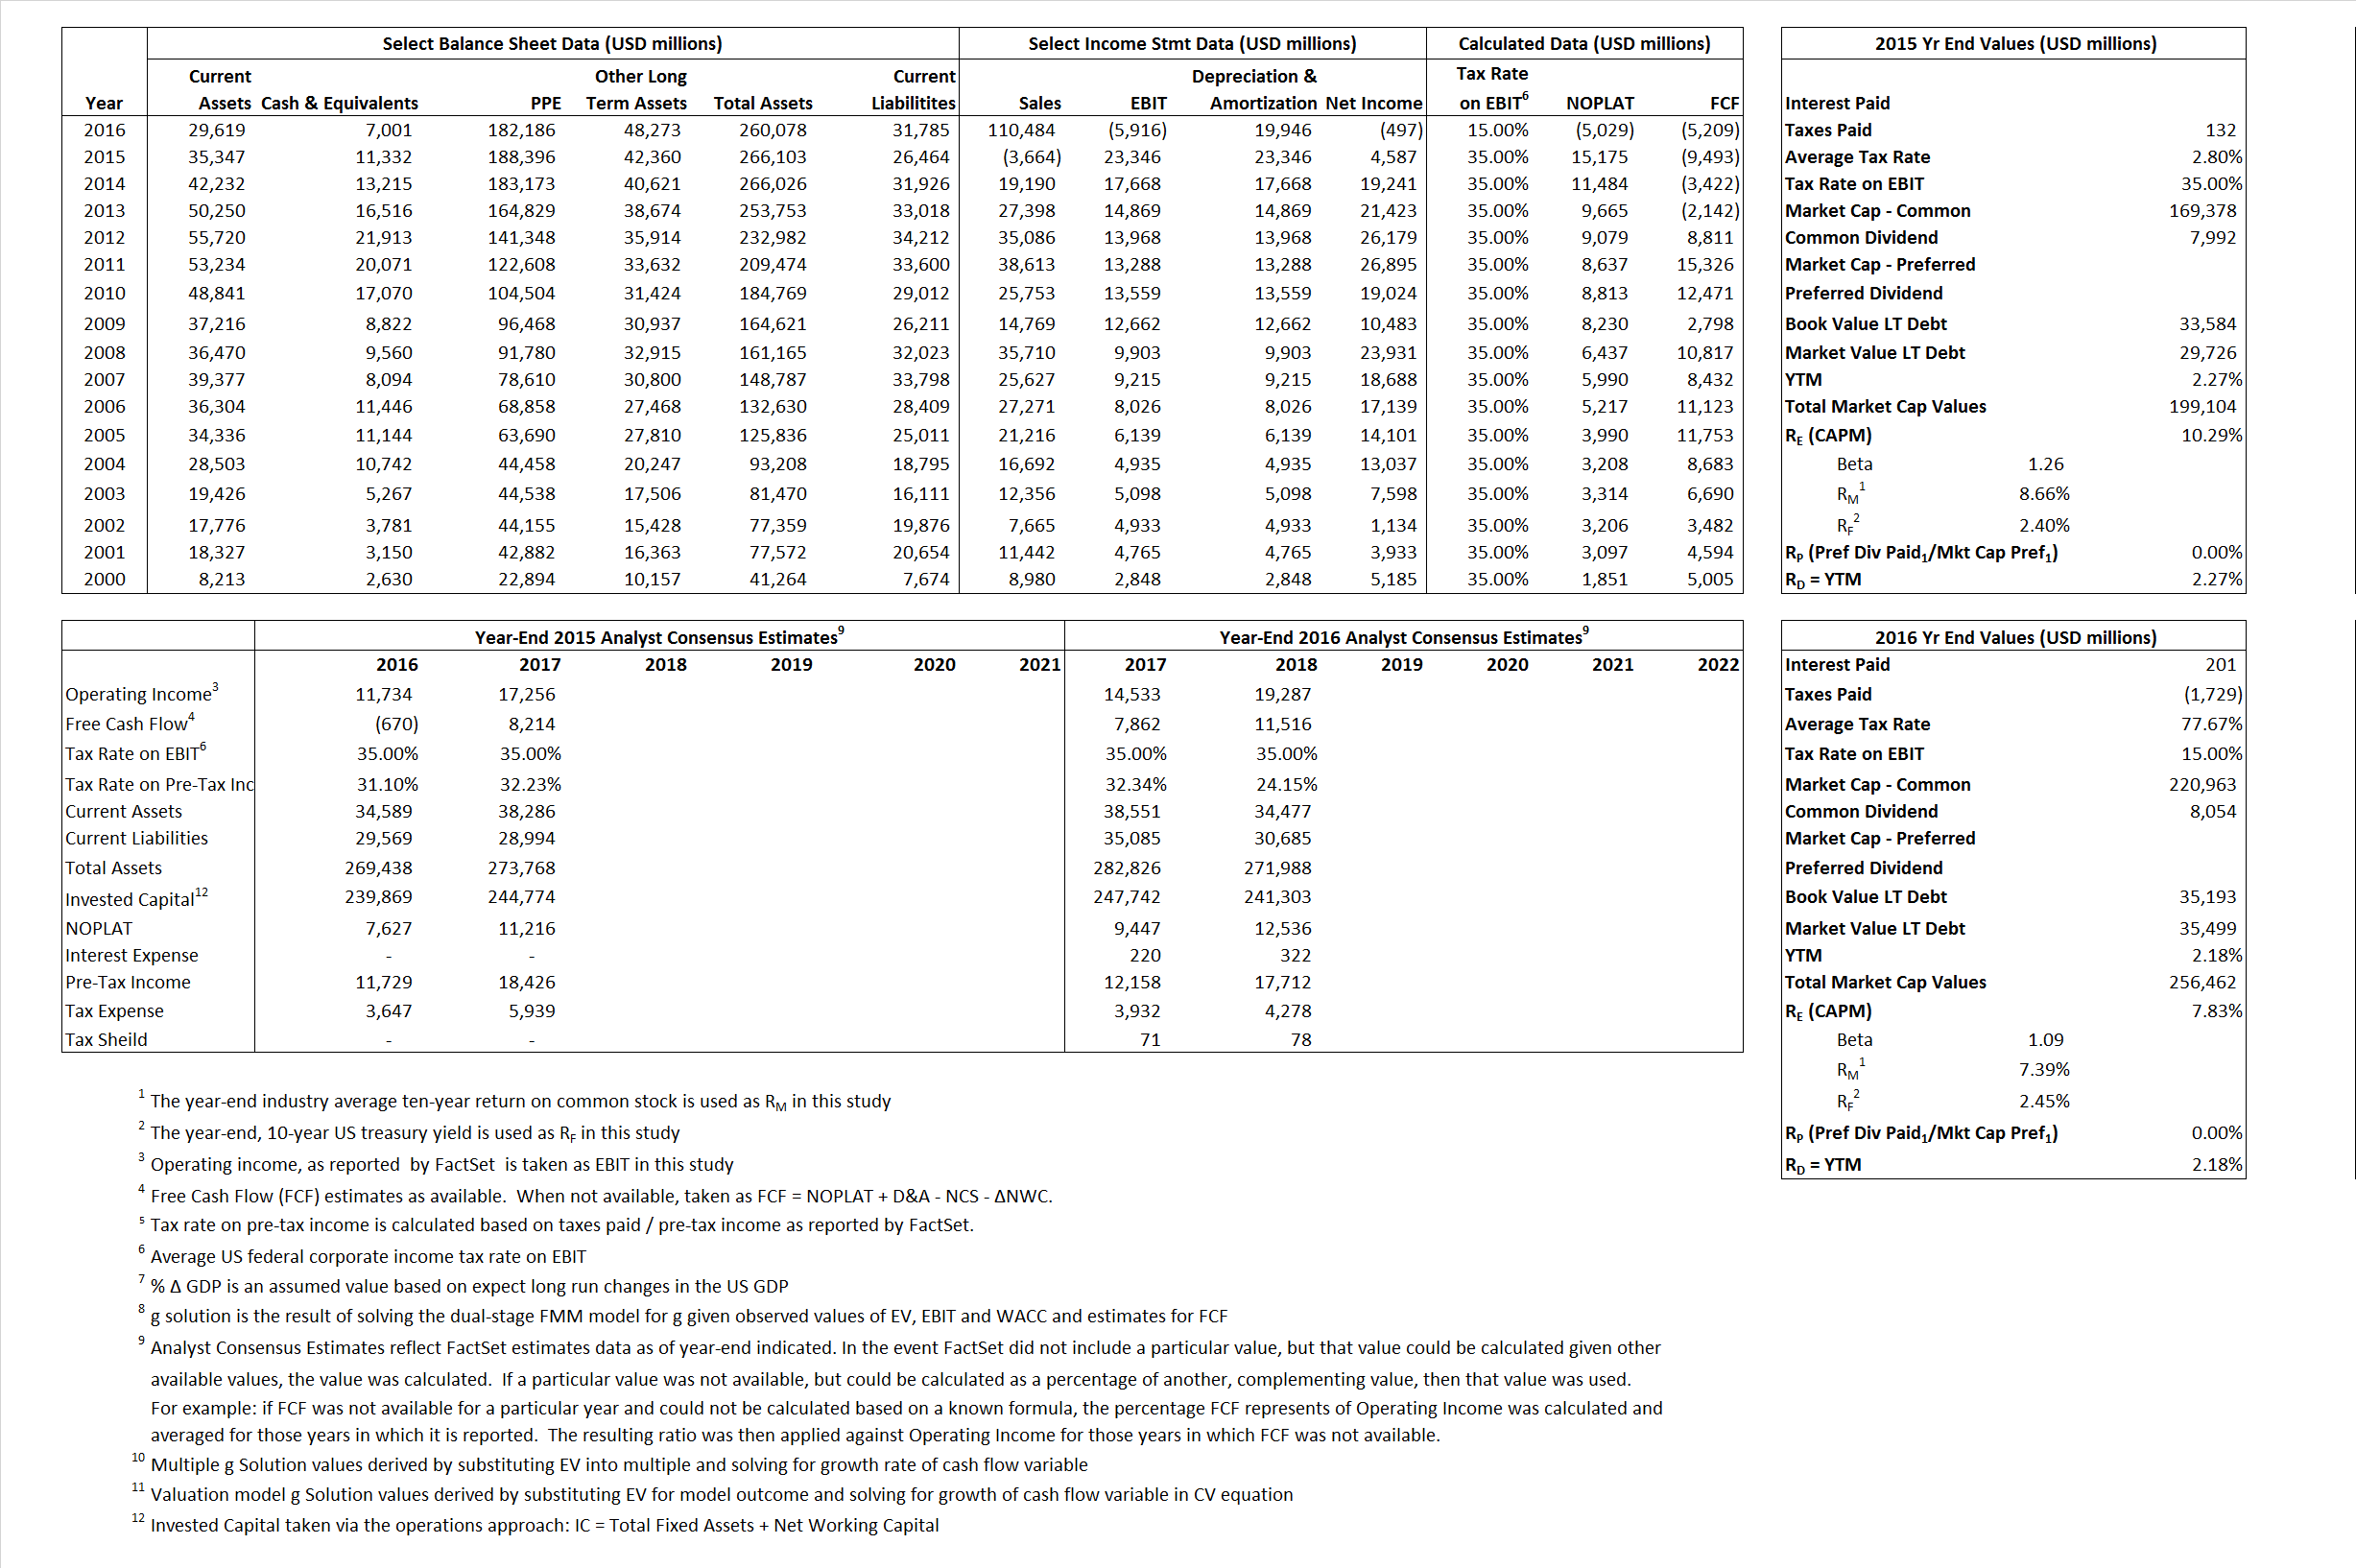
 

Return to top of page


Derived Input Data

Derived Input

Label

2015  Value

2016  Value

Equational Form

Net Operating Profit Less Adjusted Taxes NOPLAT  15,175   (5,029) NOPLAT\, =\, EBIT\, x\, (1 \,-\, Avg \,\,Tax\,\, Rate\,\, on\,\, EBIT)
Free Cash Flow FCF  (9,493)  (5,209) FCF\,=NOPLAT\,+\,Non-Cash\,Expenses-\Delta NWC\,-\,NCS
Tax Shield TS  156 TS\,=\,Interest\,\,Paid\,\,x\,\, Avg \,\,Tax\,\,Rate\,\, on\,\, Pre-Tax\,\, Income
Invested Capital IC  239,639  228,293 IC\,=\,Fixed\,\,Operating\,\,Assets\,\,+\,\,Net\,\, Working\,\, Capital
Return on Invested Capital ROIC 6.33% -2.20% ROIC\,=\,\frac { NOPLAT }{ IC }
Net Investment NetInv  28,885  8,600 NetInv\,=\,{ {IC}_{1}}-{{IC}_{0}}+Depreciation
Investment Rate IR 190.35% -171.02% IR\,=\,\frac {NetInv}{NOPLAT}
Weighted Average Cost of Capital WACCMarket 9.08% 6.82% WACC\,=\,\frac { E }{ V } { R }_{ E }\,+\,\frac { P }{ V } { R }_{ P }\,+\,\frac { D }{ V } { R }_{ D }\left( 1- Avg\,\, Tax\,\,Rate\,\,on\,\,Pre-Tax\,\,Income \right)
 WACCBook  9.60% 8.29%
Enterprise value EVMarket  187,772  249,461  EV\,=\,Market\,\,Cap\,\,Equity\,+\,\,Long\,\,Term\,\,Debt\,-\,Cash
 EVBook  191,630  249,155
EV/EBIT Multiple \frac{EV_{Market}}{EBIT}  8.04  (42.17) EV/EBIT\,=\,\frac { EV}{ EBIT}
Long-Run Growth g = IR x ROIC
  12.05%    3.77% Long-run growth rates of the income variable  are used in the Continuing Value portion of the valuation models.
 g = % \Delta GDP    2.50%   2.50%

Return to top of page


Valuation Model Outcomes

The outcomes presented in this study are the result of original input data, derived data, and synthesized inputs and, depending on the equational form of any particular valuation model, may result in irrelevant or implausible results.  For example, in the event WACC < g, the value of this term, often found in the denominator of an equation’s continuation value term, will be expressly negative and may result in a negative overall valuation for the firm.  In the event of a WACC < g relation, the model form as applied to the subject firm offers an irrelevant outcome.

Valuation Model Type

Label

Equational form

Key Value Driver (NOPLAT) KVD (NOPLAT) { Value }_{ DCF/KVD }=\sum { \frac { NOPLAT_{ t } }{ { \left( 1+WACC \right) }^{ t } } +\frac { \frac { { NOPLAT }_{ 1 }\left( 1-\frac { g }{ ROIC } \right) }{ WACC-g } }{ { \left( 1+WACC \right) }^{ t } } }
 
Key Value Driver (FCF) KVD (FCF)
{ Value }_{ DCF/KVD }=\sum { \frac { FCF_{ t } }{ { \left( 1+WACC \right) }^{ t } } +\frac { \frac { { NOPLAT }_{ 1 }\left( 1-\frac { g }{ ROIC } \right) }{ WACC-g } }{ { \left( 1+WACC \right) }^{ t } } }
 
Free Cash Flow FCF  { Value }_{ DCF/FCF }=\sum { \frac { FCF_{ t } }{ { \left( 1+WACC \right) }^{ t } } +\frac { \frac { { FCF }_{ 1 }}{ WACC-g } }{ { \left( 1+WACC \right) }^{ t } } }
 
Economic Profit ECON π  { Value }_{ { ECON\pi } }= I{ C }_{ 0 }+\sum { \frac { { IC }_{ t-1 }(ROI{ C }_{t}-WAC{C}_{t}) }{ { \left( 1+WACC \right) }^{ t } }+ \frac {\frac { I{C}_{0}\ x\ (ROI{C}_{1}\ -\ WAC{C}_{1}) }{ WACC-g } }{ { \left( 1+WACC \right) }^{ t } } }
 
Adjusted Present Value APV { Value }_{ APV }=\sum { \frac { FCF_{ t } }{ { \left( 1+{ k }_{ u } \right) }^{ t } } +\frac { \frac { { FCF }_{ 1 }}{ { k }_{ u }-g } }{ { \left( 1+{ k }_{ u } \right) }^{ t } } } +\sum { \frac { { TS }_{ t } }{ { \left( 1+{ k }_{ tax } \right) }^{ t } } +\frac { \frac { { TS }_{ 1 }}{ { k }_{ tax }-g } }{ { \left( 1+{ k }_{ tax } \right) }^{ t } } }
 
Forward Market Multiple FMM  { Value }_{ DCF/FMM}=\sum { \frac { FCF_{ t } }{ { \left( 1+WACC \right) }^{ t } } +\frac { { EBIT }_{ 1 }\,{x}\,{FMM}}{ { \left( 1+WACC \right) }^{ t } } }{\,\,\,; \,\,FMM\,=\,\frac{{EV}_{t=0}}{{EBIT}_{t=0}}}
 

Return to top of page