Gilead Sciences

Navigate firm data through the following pages:

Analyst Listing       Primary Input Data
Derived Input Data       Valuation Model Outcomes

Analyst Listing

The following analysts provide coverage for the subject firm as of May 2016:

Broker Analyst Analyst Email
Jefferies Brian Abrahams babrahams@jefferies.com
Piper Jaffray Joshua Schimmer joshua.e.schimmer@pjc.com
RBC Capital Markets Michael J. Yee michael.yee@rbccm.com
Leerink Partners Geoffrey C. Porges geoffrey.porges@leerink.com
Maxim Group Jason Kolbert jkolbert@maximgrp.com
Atlantic Equities Steve Chesney s.chesney@atlantic-equities.com
Cowen & Company Phil Nadeau phil.nadeau@cowen.com
Wells Fargo Securities Jim Birchenough jim.birchenough@wellsfargo.com
Needham Alan Carr acarr@needhamco.com
William Blair John Sonnier jsonnier@williamblair.com
BMO Capital Markets M. Ian Somaiya ian.somaiya@bmo.com
Credit Suisse Alethia Young alethia.young@credit-suisse.com
Evercore ISI Mark Schoenebaum mark.schoenebaum@evercoreisi.com
Guggenheim Securities Tony Butler tony.butler@guggenheimpartners.com

Return to top of page


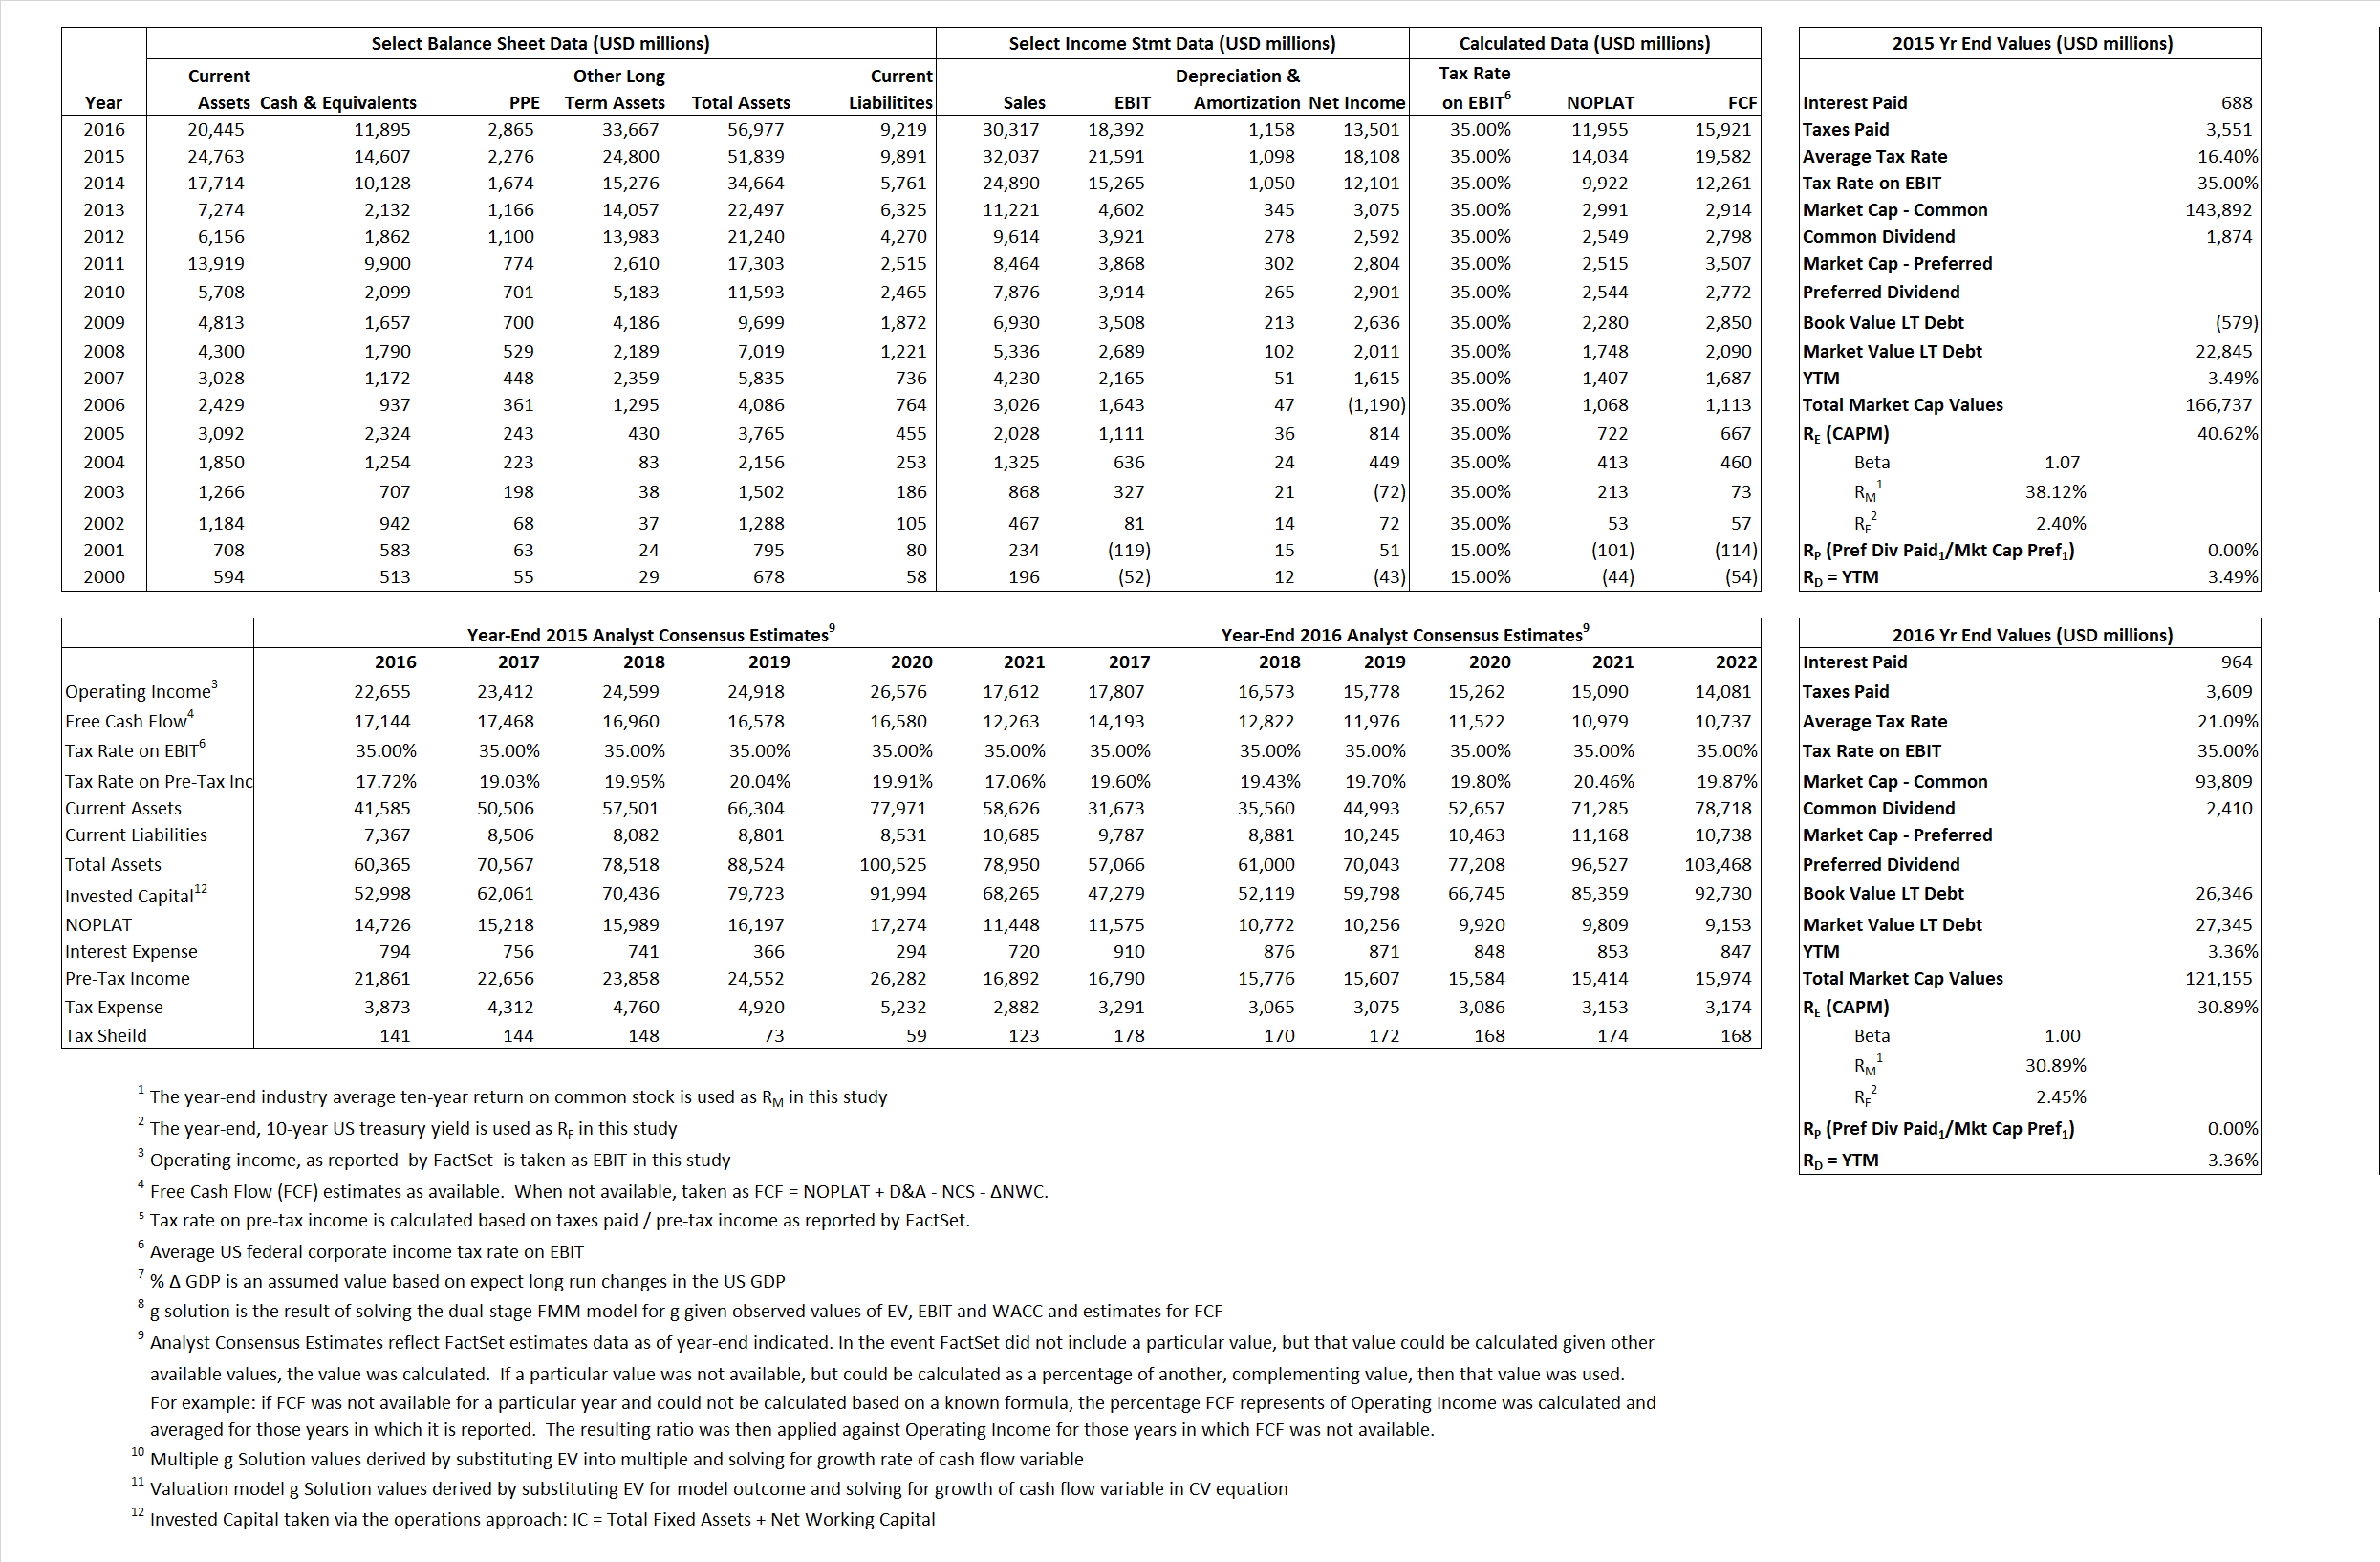
Primary Input Data
 

Return to top of page


Derived Input Data

Derived Input

Label

2015  Value

2016  Value

Equational Form

Net Operating Profit Less Adjusted Taxes NOPLAT   14,034  11,955 NOPLAT\, =\, EBIT\, x\, (1 \,-\, Avg \,\,Tax\,\, Rate\,\, on\,\, EBIT)
Free Cash Flow FCF  19,582  15,921 FCF\,=NOPLAT\,+\,Non-Cash\,Expenses-\Delta NWC\,-\,NCS
Tax Shield TS  113  203 TS\,=\,Interest\,\,Paid\,\,x\,\, Avg \,\,Tax\,\,Rate\,\, on\,\, Pre-Tax\,\, Income
Invested Capital IC  41,948  47,758 IC\,=\,Fixed\,\,Operating\,\,Assets\,\,+\,\,Net\,\, Working\,\, Capital
Return on Invested Capital ROIC 33.46% 25.03% ROIC\,=\,\frac { NOPLAT }{ IC }
Net Investment NetInv  14,143  6,968 NetInv\,=\,{ {IC}_{1}}-{{IC}_{0}}+Depreciation
Investment Rate IR 100.78% 58.29% IR\,=\,\frac {NetInv}{NOPLAT}
Weighted Average Cost of Capital WACCMarket 35.45% 24.52% WACC\,=\,\frac { E }{ V } { R }_{ E }\,+\,\frac { P }{ V } { R }_{ P }\,+\,\frac { D }{ V } { R }_{ D }\left( 1- Avg\,\, Tax\,\,Rate\,\,on\,\,Pre-Tax\,\,Income \right)
 WACCBook  8.93% 7.54%
Enterprise value EVMarket  152,130  109,260  EV\,=\,Market\,\,Cap\,\,Equity\,+\,\,Long\,\,Term\,\,Debt\,-\,Cash
 EVBook  128,706  108,260
EV/EBIT Multiple \frac{EV_{Market}}{EBIT}  7.05  5.94 EV/EBIT\,=\,\frac { EV}{ EBIT}
Long-Run Growth g = IR x ROIC
  33.72%   14.59% Long-run growth rates of the income variable  are used in the Continuing Value portion of the valuation models.
 g = % \Delta GDP    2.50%   2.50%

Return to top of page


Valuation Model Outcomes

The outcomes presented in this study are the result of original input data, derived data, and synthesized inputs and, depending on the equational form of any particular valuation model, may result in irrelevant or implausible results.  For example, in the event WACC < g, the value of this term, often found in the denominator of an equation’s continuation value term, will be expressly negative and may result in a negative overall valuation for the firm.  In the event of a WACC < g relation, the model form as applied to the subject firm offers an irrelevant outcome.

Valuation Model Type

Label

Equational form

Key Value Driver (NOPLAT) KVD (NOPLAT) { Value }_{ DCF/KVD }=\sum { \frac { NOPLAT_{ t } }{ { \left( 1+WACC \right) }^{ t } } +\frac { \frac { { NOPLAT }_{ 1 }\left( 1-\frac { g }{ ROIC } \right) }{ WACC-g } }{ { \left( 1+WACC \right) }^{ t } } }
 
Key Value Driver (FCF) KVD (FCF)
{ Value }_{ DCF/KVD }=\sum { \frac { FCF_{ t } }{ { \left( 1+WACC \right) }^{ t } } +\frac { \frac { { NOPLAT }_{ 1 }\left( 1-\frac { g }{ ROIC } \right) }{ WACC-g } }{ { \left( 1+WACC \right) }^{ t } } }
 
Free Cash Flow FCF  { Value }_{ DCF/FCF }=\sum { \frac { FCF_{ t } }{ { \left( 1+WACC \right) }^{ t } } +\frac { \frac { { FCF }_{ 1 }}{ WACC-g } }{ { \left( 1+WACC \right) }^{ t } } }
 
Economic Profit ECON π  { Value }_{ { ECON\pi } }= I{ C }_{ 0 }+\sum { \frac { { IC }_{ t-1 }(ROI{ C }_{t}-WAC{C}_{t}) }{ { \left( 1+WACC \right) }^{ t } }+ \frac {\frac { I{C}_{0}\ x\ (ROI{C}_{1}\ -\ WAC{C}_{1}) }{ WACC-g } }{ { \left( 1+WACC \right) }^{ t } } }
 
Adjusted Present Value APV { Value }_{ APV }=\sum { \frac { FCF_{ t } }{ { \left( 1+{ k }_{ u } \right) }^{ t } } +\frac { \frac { { FCF }_{ 1 }}{ { k }_{ u }-g } }{ { \left( 1+{ k }_{ u } \right) }^{ t } } } +\sum { \frac { { TS }_{ t } }{ { \left( 1+{ k }_{ tax } \right) }^{ t } } +\frac { \frac { { TS }_{ 1 }}{ { k }_{ tax }-g } }{ { \left( 1+{ k }_{ tax } \right) }^{ t } } }
 
Forward Market Multiple FMM  { Value }_{ DCF/FMM}=\sum { \frac { FCF_{ t } }{ { \left( 1+WACC \right) }^{ t } } +\frac { { EBIT }_{ 1 }\,{x}\,{FMM}}{ { \left( 1+WACC \right) }^{ t } } }{\,\,\,; \,\,FMM\,=\,\frac{{EV}_{t=0}}{{EBIT}_{t=0}}}
 

Return to top of page