Morgan Stanley
Navigate firm data through the following pages:
| Analyst Listing | Primary Input Data |
| Derived Input Data | Valuation Model Outcomes |
Analyst Listing
The following analysts provide coverage for the subject firm as of May 2016:
| Broker | Analyst | Analyst Email |
| Keefe Bruyette & Woods | Brian Kleinhanzl | bkleinhanzl@kbw.com |
| Oppenheimer | Chris Kotowski | chris.kotowski@opco.com |
| Credit Suisse | Christian Bolu | christian.bolu@credit-suisse.com |
| Atlantic Equities | Christopher Wheeler | c.wheeler@atlantic-equities.com |
| Drexel Hamilton | David Hilder | dhilder@drexelhamilton.com |
| JMP Securities | Devin Ryan | dryan@jmpsecurities.com |
| Guggenheim Securities | Eric Wasserstrom | eric.wasserstrom@guggenheimpartners.com |
| RBC Capital Markets | Fiona Swaffield | fiona.swaffield@rbccm.com |
| Evercore ISI | Glenn Schorr | glenn.schorr@evercoreisi.com |
| BMO Capital Markets | James Fotheringham | james.fotheringham@bmo.com |
| Buckingham Research | James Mitchell | jmitchell@buckresearch.com |
| Sandler O’Neill & Partners | Jeffery J. Harte | jharte@sandleroneill.com |
| Wells Fargo Securities | Matthew H. Burnell | matt.burnell@wellsfargo.com |
| Deutsche Bank Research | Matthew O’Connor | matthew.o-connor@db.com |
| Nomura Research | Steven Chubak | steven.chubak@nomura.com |
Primary Input Data
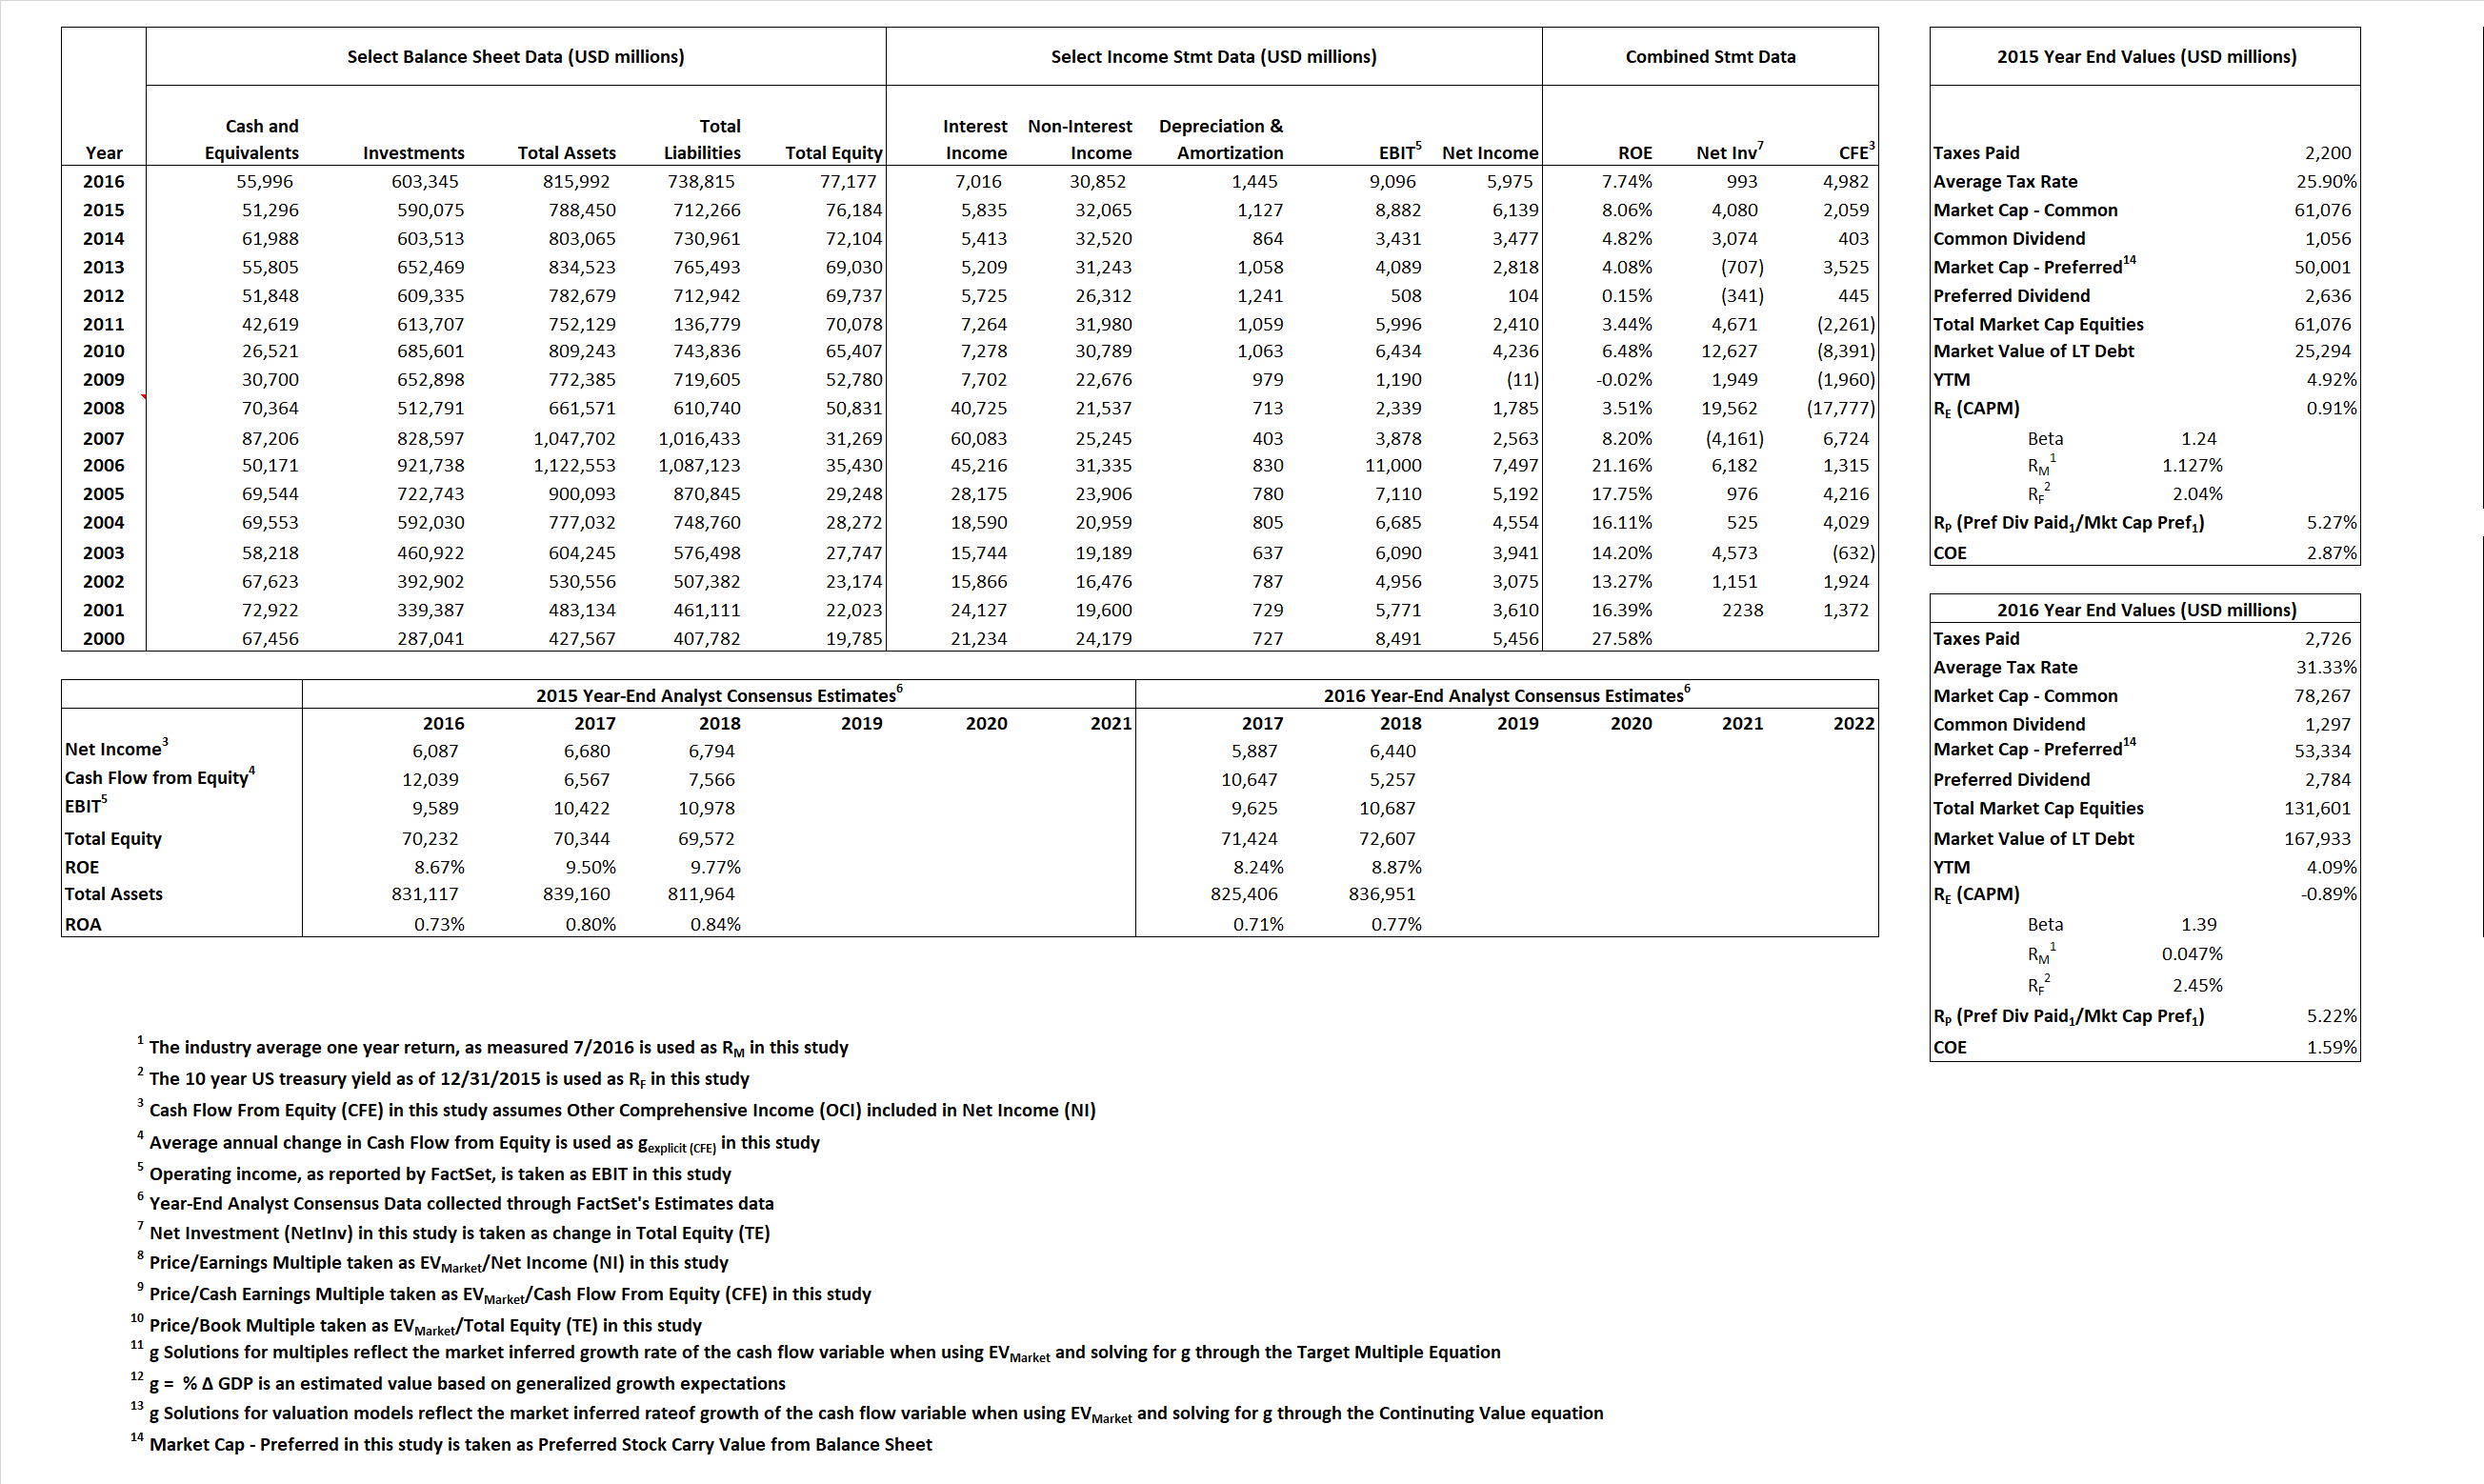
Derived Input Data
Derived Input |
Label |
2015 Value
|
2016 Value |
Equational Form |
| Net Income | NI |  |
||
| Cash Flow From Equity | CFE |  |
||
| Total Equity | TE |  |
||
| Return on Equity | ROE |  |
||
| Net Investment | NetInv |  |
||
| Investment Rate | IR |  |
||
| Cost of Equity | COE |  |
||
| Enterprise value | EVMarket |  |
||
| EVBook | ||||
| EV/EBIT Multiple |  |
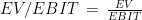 |
||
| Long-Run Growth | g = %  GDP GDP |
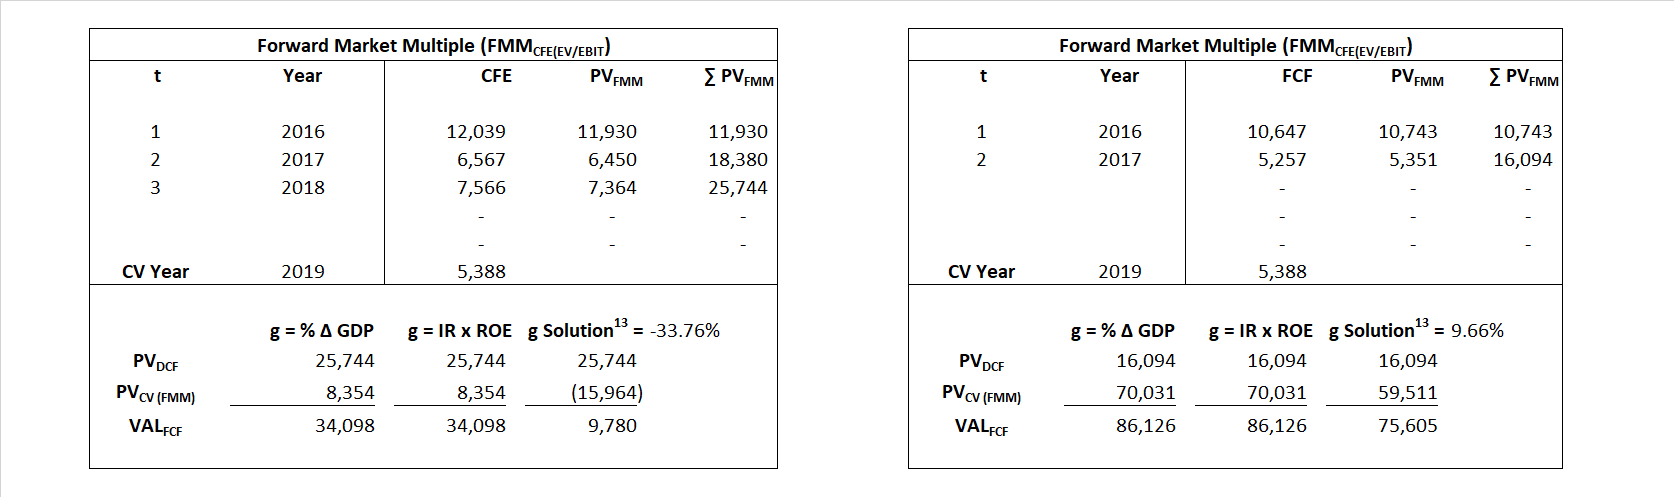
Long-run growth rates of the income variable (g = IR x ROIC and g = % GDP) are used in the Continuing Value portion of the valuation models. |
||
| g = IR x ROIC |
Valuation Model Outcomes
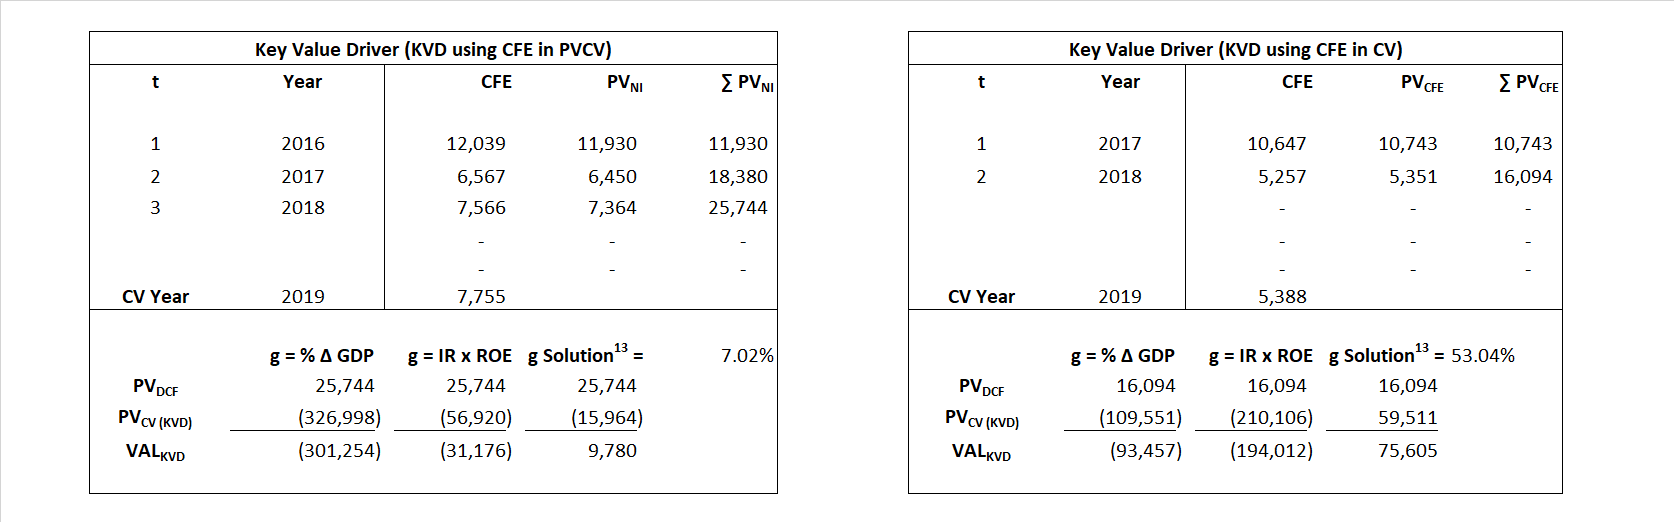
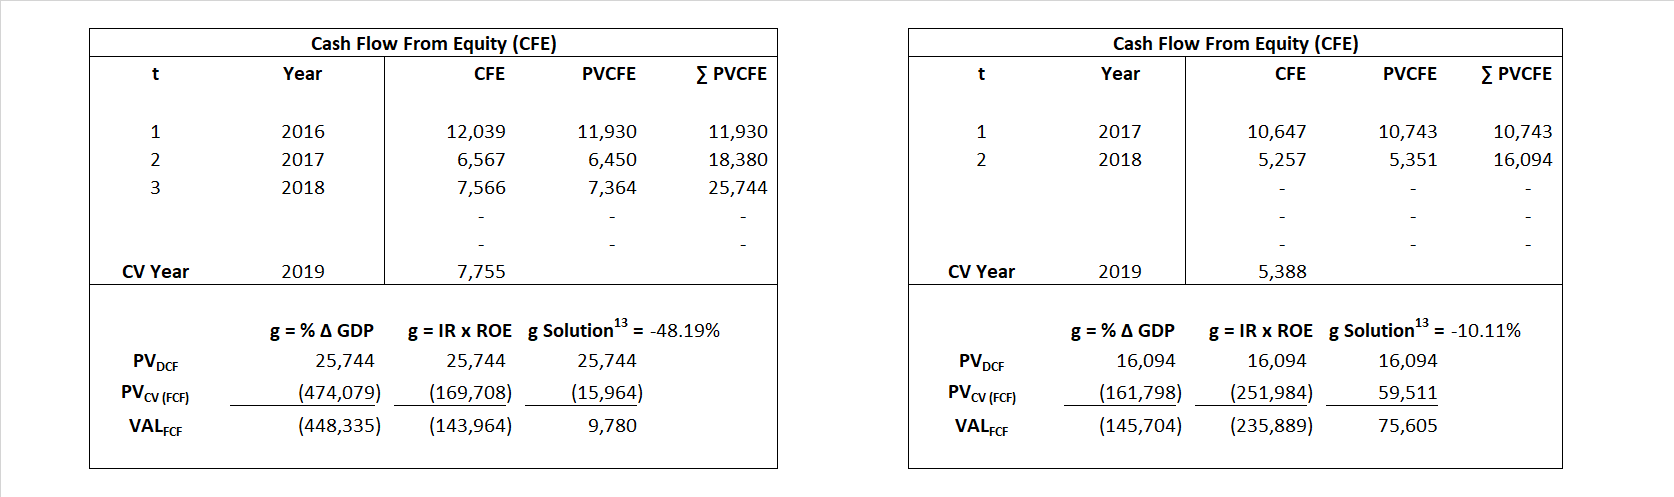
The outcomes presented in this study are the result of original input data, derived data, and synthesized inputs and, depending on the equational form of any particular valuation model, may result in irrelevant or implausible results. For example, in the event WACC < g, the value of this term, often found in the denominator of an equation’s continuation value term, will be expressly negative and may result in a negative overall valuation for the firm. In the event of a WACC < g relation, the model form as applied to the subject firm offers an irrelevant outcome.
Valuation Model Type |
Label |
Equational form
|
|
| Key Value Driver (NI) | KVD (NI) |  |
|
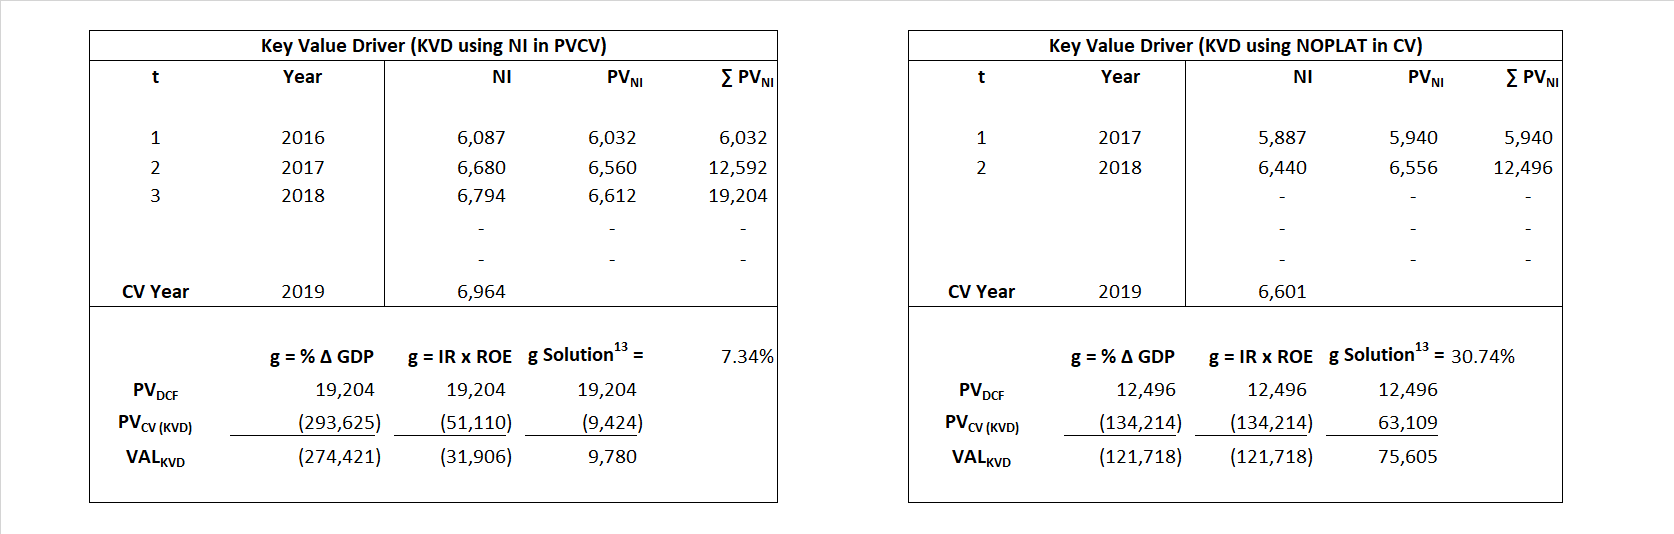 |
|||
| Key Value Driver (CFE) | KVD (CFE) |
|
|
 |
|||
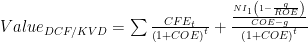
| Cash Flow From Equity | CFE | 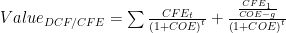 |
|
 |
|||
| Economic Profit | ECON π |  |
|
 |
|||
| Forward Market Multiple | FMM |  |
|
 |
|||