Nike

Navigate firm data through the following pages:

Analyst Listing       Primary Input Data
Derived Input Data       Valuation Model Outcomes

Analyst Listing

The following analysts provide coverage for the subject firm as of May 2016:

Broker Analyst Analyst Email
DA Davidson Andrew Burns aburns@dadco.com
Canaccord Genuity Camilo Lyon clyon@canaccordgenuity.com
Credit Suisse Christian Buss christian.buss@credit-suisse.com
Susquehanna Financial Group Christopher Svezia christopher.svezia@sig.com
BB&T Capital Markets Corinna L. Freedman cfreedman@bbandtcm.com
Jefferies Edward Plank eplank@jefferies.com
Brean Capital, LLC Eric B. Tracy etracy@breancapital.com
Piper Jaffray Erinn E. Murphy erinn.e.murphy@pjc.com
Hilliard Lyons Jeffrey S. Thomison jthomison@hilliard.com
Stifel Nicolaus Jim Duffy jduffy@stifel.com
Cowen & Company John Kernan john.kernan@cowen.com
Telsey Advisory Group Kelly Chen kchen@telseygroup.com
B Riley & Co Mitch Kummetz mkummetz@brileyco.com
Evercore ISI Omar Saad omar.saad@evercoreisi.com
Nomura Research Robert S. Drbul robert.drbul@nomura.com
CRT Capital Group Sam Poser sposer@sterneageecrt.com
Buckingham Research Scott Krasik skrasik@buckresearch.com
FBR Capital Markets & Co Susan Anderson sanderson@fbr.com
Wells Fargo Securities Tom Nikic tom.nikic@wellsfargo.com

Return to top of page


Primary Input Data
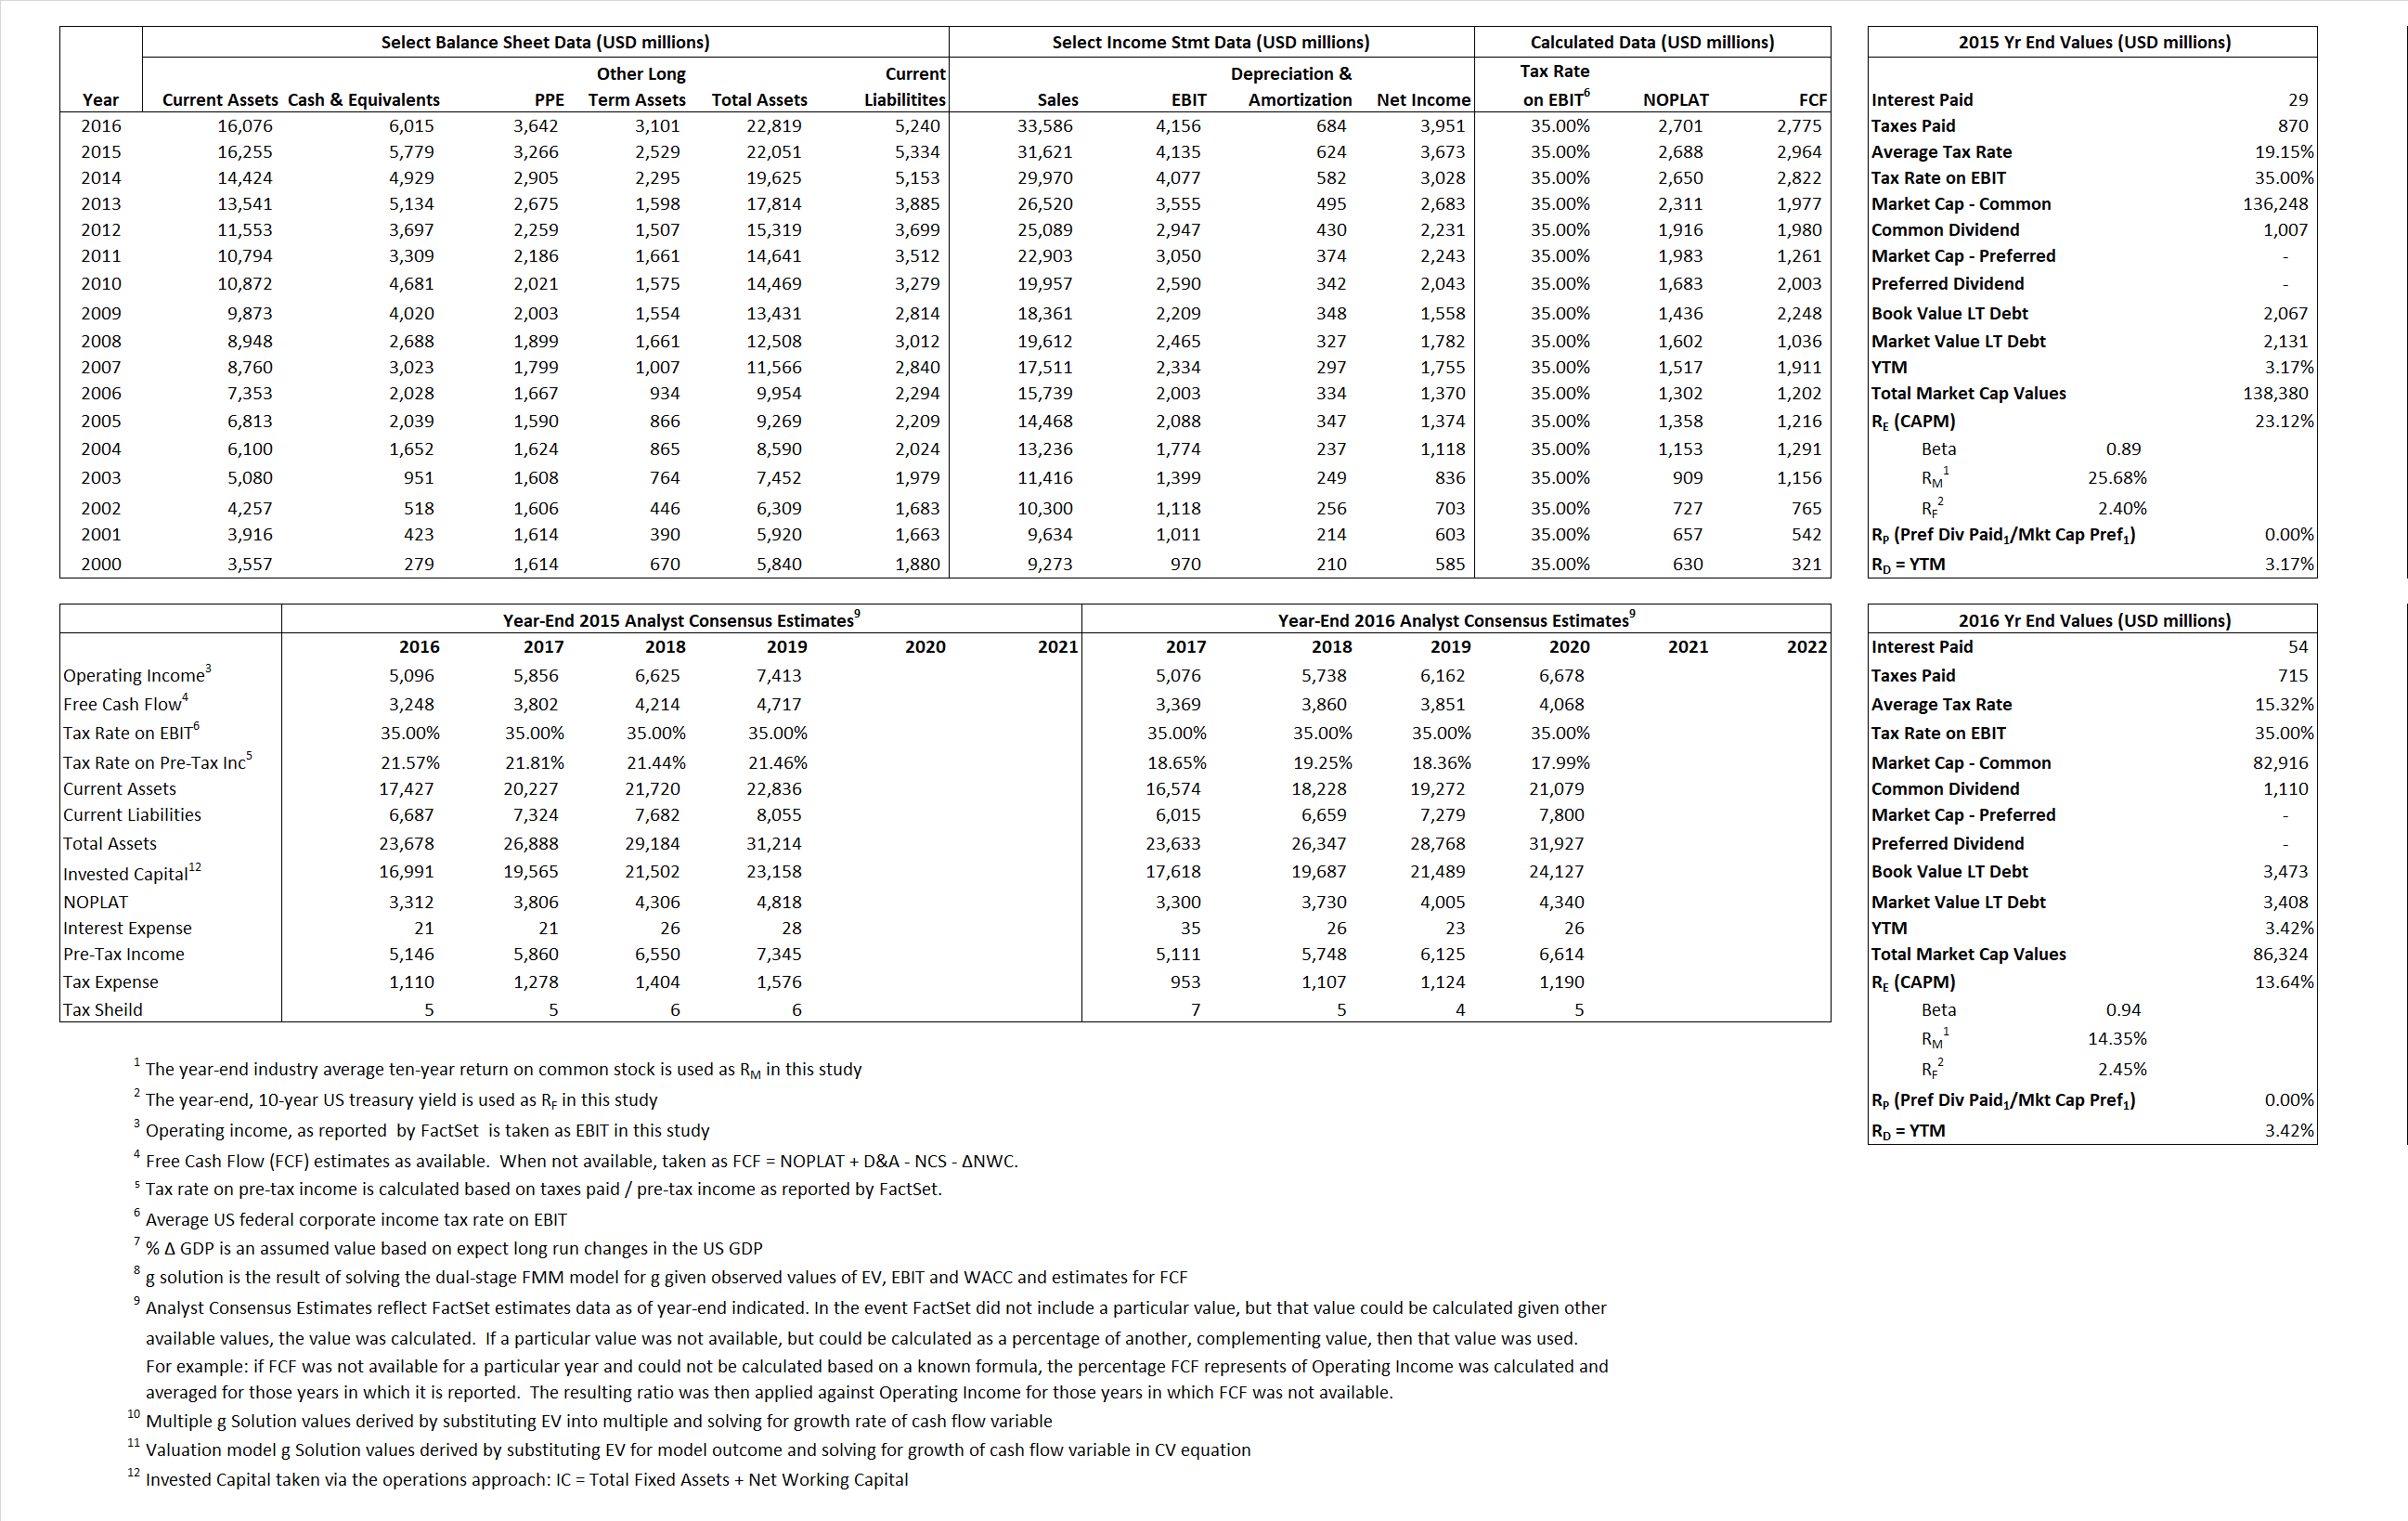
 

Return to top of page


Derived Input Data

Derived Input

Label

2015  Value

2016  Value

Equational Form

Net Operating Profit Less Adjusted Taxes NOPLAT   2,688  2,701 NOPLAT\, =\, EBIT\, x\, (1 \,-\, Avg \,\,Tax\,\, Rate\,\, on\,\, EBIT)
Free Cash Flow FCF  2,964  2,775 FCF\,=NOPLAT\,+\,Non-Cash\,Expenses-\Delta NWC\,-\,NCS
Tax Shield TS  6  8 TS\,=\,Interest\,\,Paid\,\,x\,\, Avg \,\,Tax\,\,Rate\,\, on\,\, Pre-Tax\,\, Income
Invested Capital IC  16,717  17,578 IC\,=\,Fixed\,\,Operating\,\,Assets\,\,+\,\,Net\,\, Working\,\, Capital
Return on Invested Capital ROIC 16.08% 15.37% ROIC\,=\,\frac { NOPLAT }{ IC }
Net Investment NetInv  2,869  1,545 NetInv\,=\,{ {IC}_{1}}-{{IC}_{0}}+Depreciation
Investment Rate IR 106.75% 57.20% IR\,=\,\frac {NetInv}{NOPLAT}
Weighted Average Cost of Capital WACCMarket 22.80% 13.21% WACC\,=\,\frac { E }{ V } { R }_{ E }\,+\,\frac { P }{ V } { R }_{ P }\,+\,\frac { D }{ V } { R }_{ D }\left( 1- Avg\,\, Tax\,\,Rate\,\,on\,\,Pre-Tax\,\,Income \right)
 WACCBook  8.52% 8.86%
Enterprise value EVMarket  132,600  80,309  EV\,=\,Market\,\,Cap\,\,Equity\,+\,\,Long\,\,Term\,\,Debt\,-\,Cash
 EVBook  132,300  80,374
EV/EBIT Multiple \frac{EV_{Market}}{EBIT}  32.07  19.33 EV/EBIT\,=\,\frac { EV}{ EBIT}
Long-Run Growth g = IR x ROIC
  17.16%   8.79% Long-run growth rates of the income variable  are used in the Continuing Value portion of the valuation models.
 g = % \Delta GDP   2.50%   2.50%

Return to top of page


Valuation Model Outcomes

The outcomes presented in this study are the result of original input data, derived data, and synthesized inputs and, depending on the equational form of any particular valuation model, may result in irrelevant or implausible results.  For example, in the event WACC < g, the value of this term, often found in the denominator of an equation’s continuation value term, will be expressly negative and may result in a negative overall valuation for the firm.  In the event of a WACC < g relation, the model form as applied to the subject firm offers an irrelevant outcome.

Valuation Model Type

Label

Equational form

Key Value Driver (NOPLAT) KVD (NOPLAT) { Value }_{ DCF/KVD }=\sum { \frac { NOPLAT_{ t } }{ { \left( 1+WACC \right) }^{ t } } +\frac { \frac { { NOPLAT }_{ 1 }\left( 1-\frac { g }{ ROIC } \right) }{ WACC-g } }{ { \left( 1+WACC \right) }^{ t } } }
 
Key Value Driver (FCF) KVD (FCF)
{ Value }_{ DCF/KVD }=\sum { \frac { FCF_{ t } }{ { \left( 1+WACC \right) }^{ t } } +\frac { \frac { { NOPLAT }_{ 1 }\left( 1-\frac { g }{ ROIC } \right) }{ WACC-g } }{ { \left( 1+WACC \right) }^{ t } } }
 
Free Cash Flow FCF  { Value }_{ DCF/FCF }=\sum { \frac { FCF_{ t } }{ { \left( 1+WACC \right) }^{ t } } +\frac { \frac { { FCF }_{ 1 }}{ WACC-g } }{ { \left( 1+WACC \right) }^{ t } } }
 
Economic Profit ECON π  { Value }_{ { ECON\pi } }= I{ C }_{ 0 }+\sum { \frac { { IC }_{ t-1 }(ROI{ C }_{t}-WAC{C}_{t}) }{ { \left( 1+WACC \right) }^{ t } }+ \frac {\frac { I{C}_{0}\ x\ (ROI{C}_{1}\ -\ WAC{C}_{1}) }{ WACC-g } }{ { \left( 1+WACC \right) }^{ t } } }
 
Adjusted Present Value APV { Value }_{ APV }=\sum { \frac { FCF_{ t } }{ { \left( 1+{ k }_{ u } \right) }^{ t } } +\frac { \frac { { FCF }_{ 1 }}{ { k }_{ u }-g } }{ { \left( 1+{ k }_{ u } \right) }^{ t } } } +\sum { \frac { { TS }_{ t } }{ { \left( 1+{ k }_{ tax } \right) }^{ t } } +\frac { \frac { { TS }_{ 1 }}{ { k }_{ tax }-g } }{ { \left( 1+{ k }_{ tax } \right) }^{ t } } }
 
Forward Market Multiple FMM  { Value }_{ DCF/FMM}=\sum { \frac { FCF_{ t } }{ { \left( 1+WACC \right) }^{ t } } +\frac { { EBIT }_{ 1 }\,{x}\,{FMM}}{ { \left( 1+WACC \right) }^{ t } } }{\,\,\,; \,\,FMM\,=\,\frac{{EV}_{t=0}}{{EBIT}_{t=0}}}
 

Return to top of page